Business Intelligence Reports (BI)
Make data-driven decisions
Access actionable insights with Cognitive ERP's BI reports Stay ahead in a competitive landscape

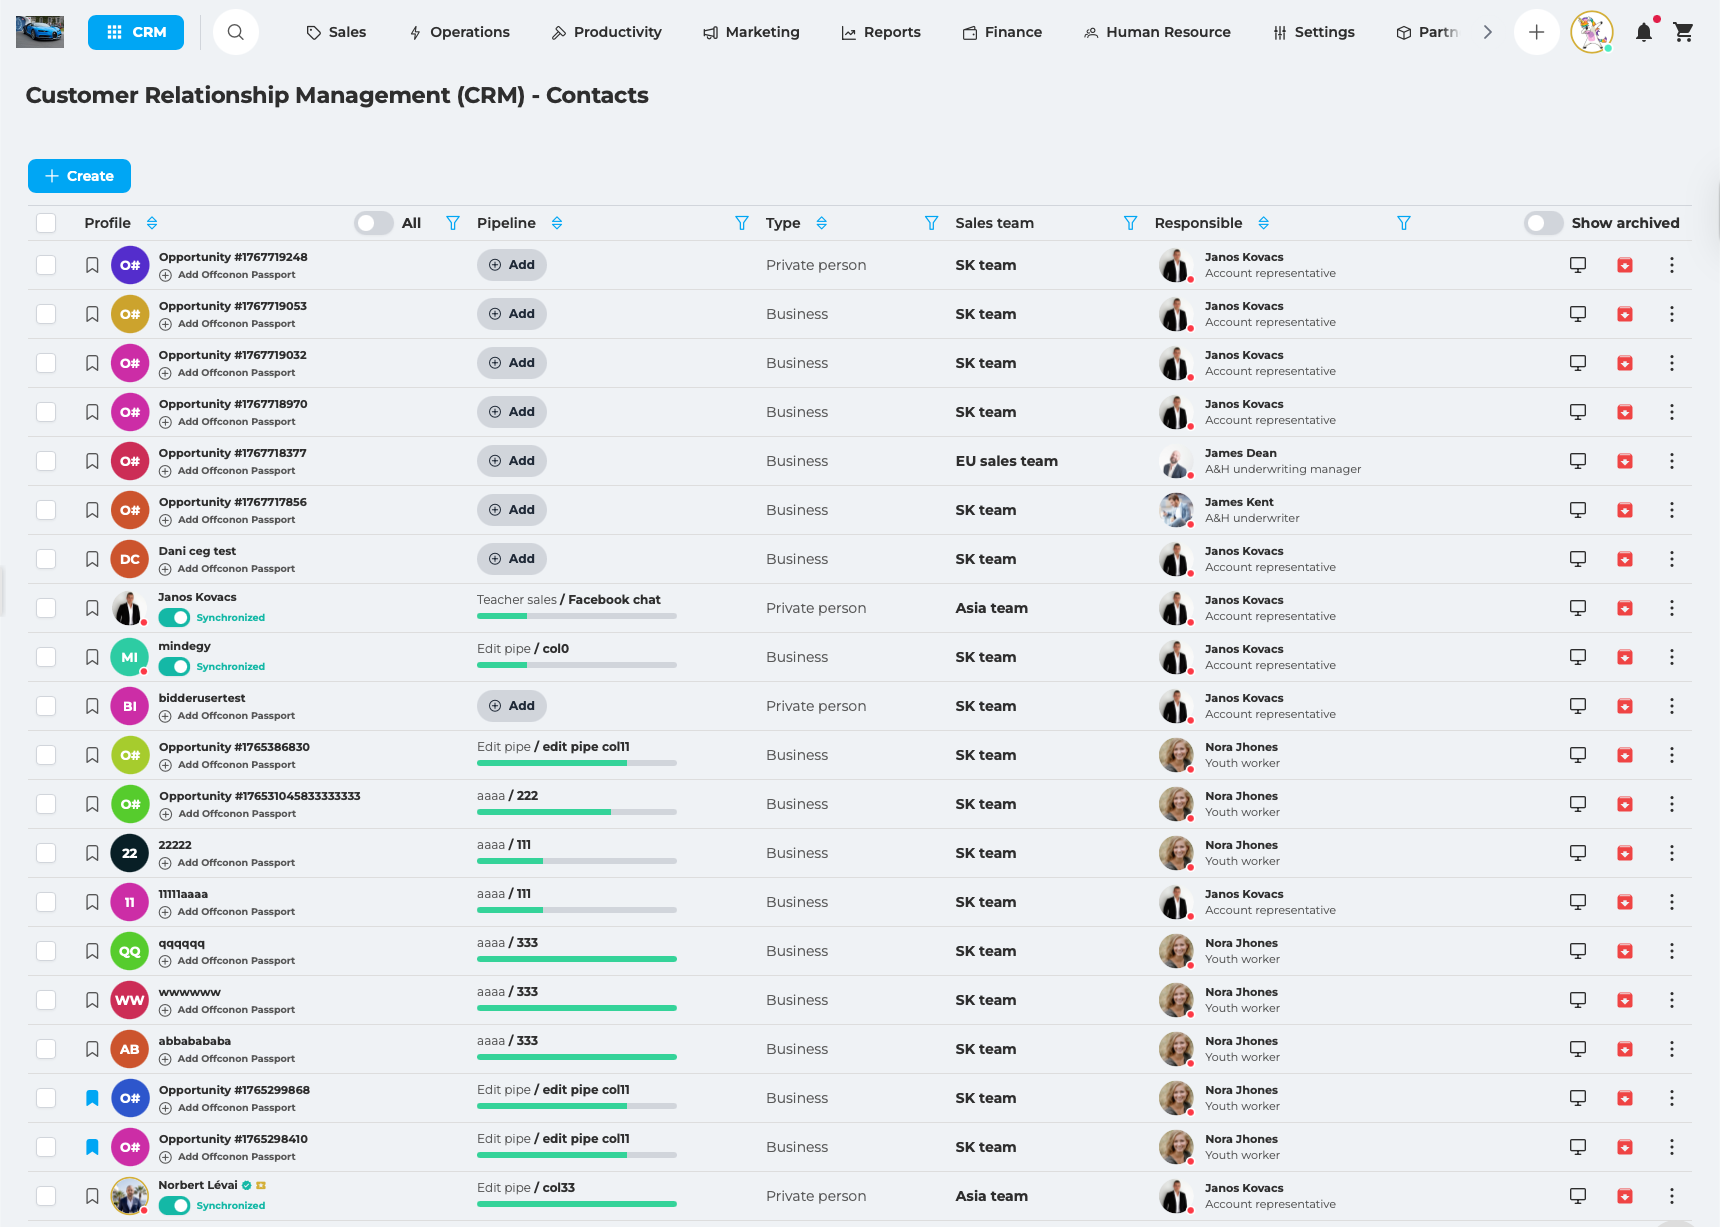
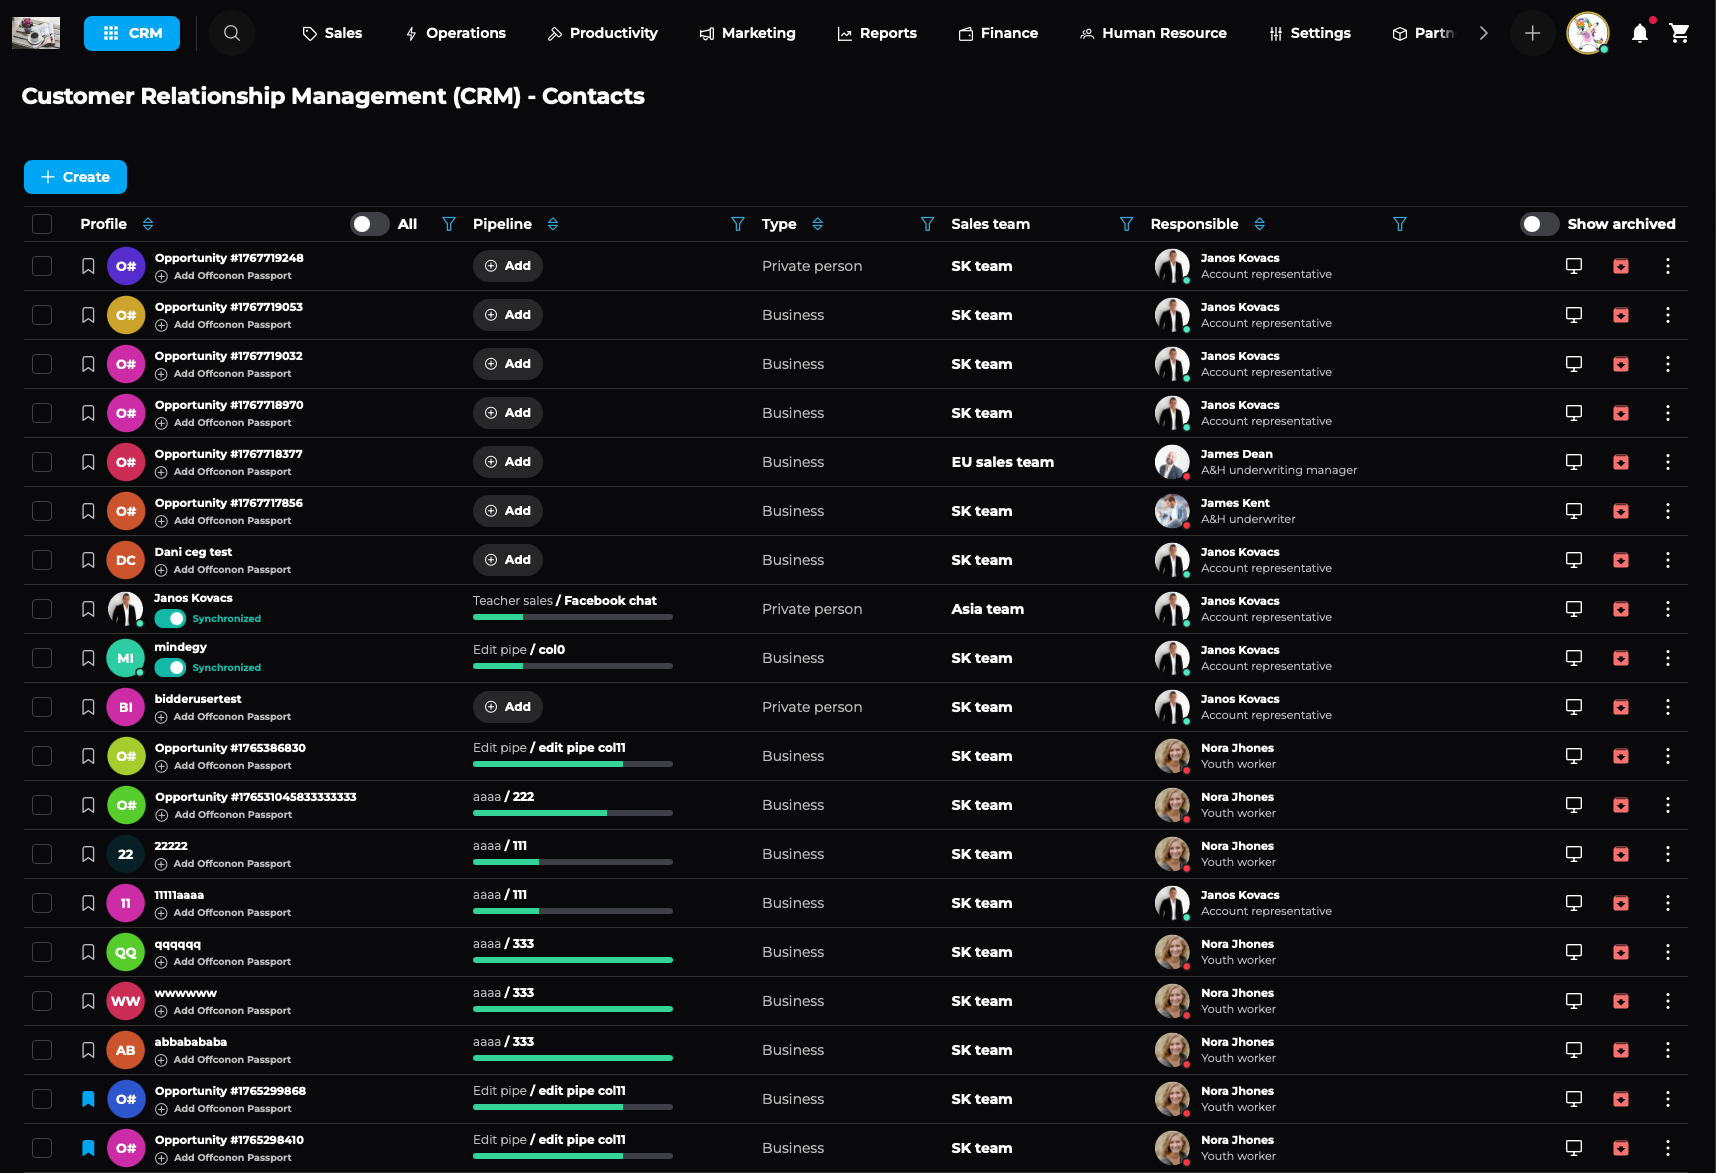
Interactive dashboards
Ad-hoc reporting
Data visualization
Predictive analytics
Ready to unlock insights from your data?
Transform raw data into actionable intelligence
Move the circle to see different themes
Interactive dashboards
Visualize key metrics with customizable, real-time dashboards tailored to your role
- Drag-and-drop dashboard builder
- 20+ chart types and visualization options
- Role-based dashboard views (CEO, Sales, Finance)
Move the circle to see different themes
Ad-hoc reporting
Create custom reports on the fly without needing IT assistance
- Intuitive report builder with filters
- Save and schedule reports for automatic delivery
- Export to PDF, Excel, and PowerPoint
Move the circle to see different themes
Data visualization
Spot trends, patterns, and outliers instantly with rich visual representations
- Sales performance heatmaps
- Inventory turnover analysis
- Customer segmentation visuals
Move the circle to see different themes
Predictive analytics
Leverage historical data to forecast trends and make proactive decisions
- Sales forecasting models
- Churn prediction and risk scoring
- Demand forecasting for inventory planning
Your questions, answered
Ready to unlock insights from your data?
Transform raw data into actionable intelligence